Defining User Journey and Conversion Funnel in a Catalog
The user journey within a catalog differs slightly from a traditional sales funnel, as it is focused heavily on interactions within the content layers.
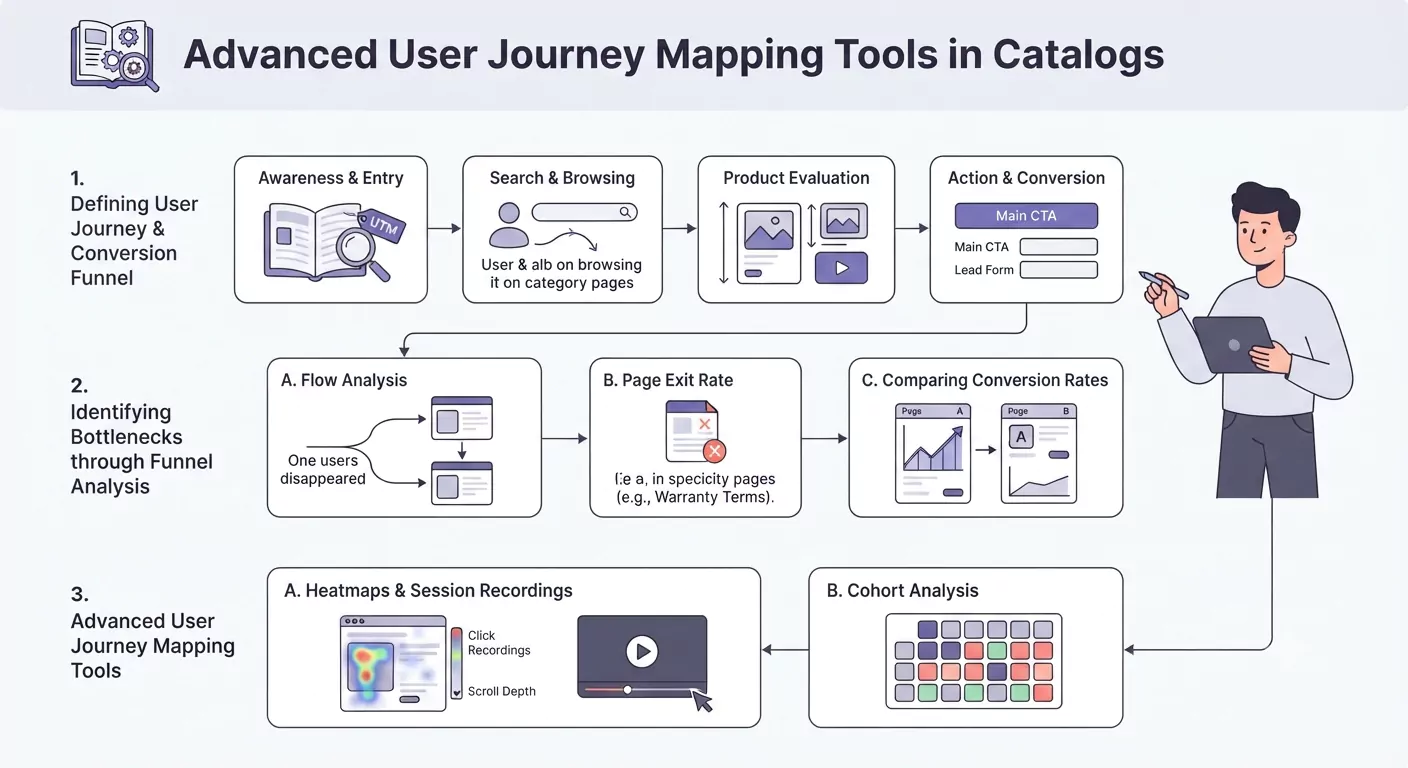
| Stage in Catalog | User's Main Objective | Key Metrics |
|---|---|---|
| Awareness & Entry | Overall understanding of the catalog and product range | Catalog open rate, Traffic source (UTM) |
| Search & Browsing | Finding the desired category or product | Search tool usage rate, Browsing rate, Dwell time on category pages |
| Product Evaluation | Detailed understanding of preferred product features | Click rate on image galleries, Scroll depth, Video view rate |
| Action & Conversion | Requesting a quote, downloading, or contacting | Click rate on the main CTA, Lead form conversion rate |
Identifying Bottlenecks through Funnel Analysis
The primary goal of User Journey Mapping is locating the specific pages or steps where the highest volume of customer drop-off occurs.
A) Flow Analysis
Observe which pages users navigate to after entering a product page.
- Insight: If many users move from page A to page B, but completely disappear after page B, page B is a bottleneck and likely contains incomplete or overly complex information.
B) Page Exit Rate
Examining the pages that have the highest Exit Rate, which are not necessarily the final page of the user's browsing session.
- Example: If the exit rate from the "Warranty Terms" page is high, your terms might be too strict or poorly explained.
C) Comparing Conversion Rates of Similar Pages
If two similar products (A and B) belong to the same category but product A's conversion rate is significantly higher, page A's layout and content should be used as the optimal blueprint for page B.
Advanced User Journey Mapping Tools in Lenoos
A smart catalog platform must provide analytical tools that go far beyond standard Google Analytics:
A) Heatmaps and Session Recordings
- Heatmaps: They display exactly where users click and how far down a page they scroll. This helps you understand whether your CTA is positioned effectively "Above the Fold."
- Session Recordings: Video playbacks of a real user's browsing experience offer the best way to identify frustration points or technical friction.
B) Cohort Analysis for Long Journeys
For B2B products with extended sales cycles, cohort analysis reveals whether users return to the same product page after a week. This assists heavily in evaluating the effectiveness of follow-up emails.
Final Words
A smart catalog equipped with advanced analytics tools allows you to explore the customer's journey like an explorer. By accurately identifying the points where users pause, backtrack, or leave entirely, you can execute targeted content refinement, improve layouts, and implement performance optimization. User journey mapping is a continuous process that ultimately results in a seamless conversion funnel and an flawless user experience within your digital catalog.